
A Grouped Sales Report makes it possible to generate an Excel report in the Back Office. You can use the following filters when exporting the data:
-
Store: generate report for all, one, or several stores
-
Business date (required): define time range to filter.
-
Category Type: Default value: group. Only one category type is available for filtering.
-
Category: You can generate report for all, one, or several categories based on the chosen category type.
Generate a Grouped Sales Report
-
Click Statistics in the Back Office menu and select Sales Report.
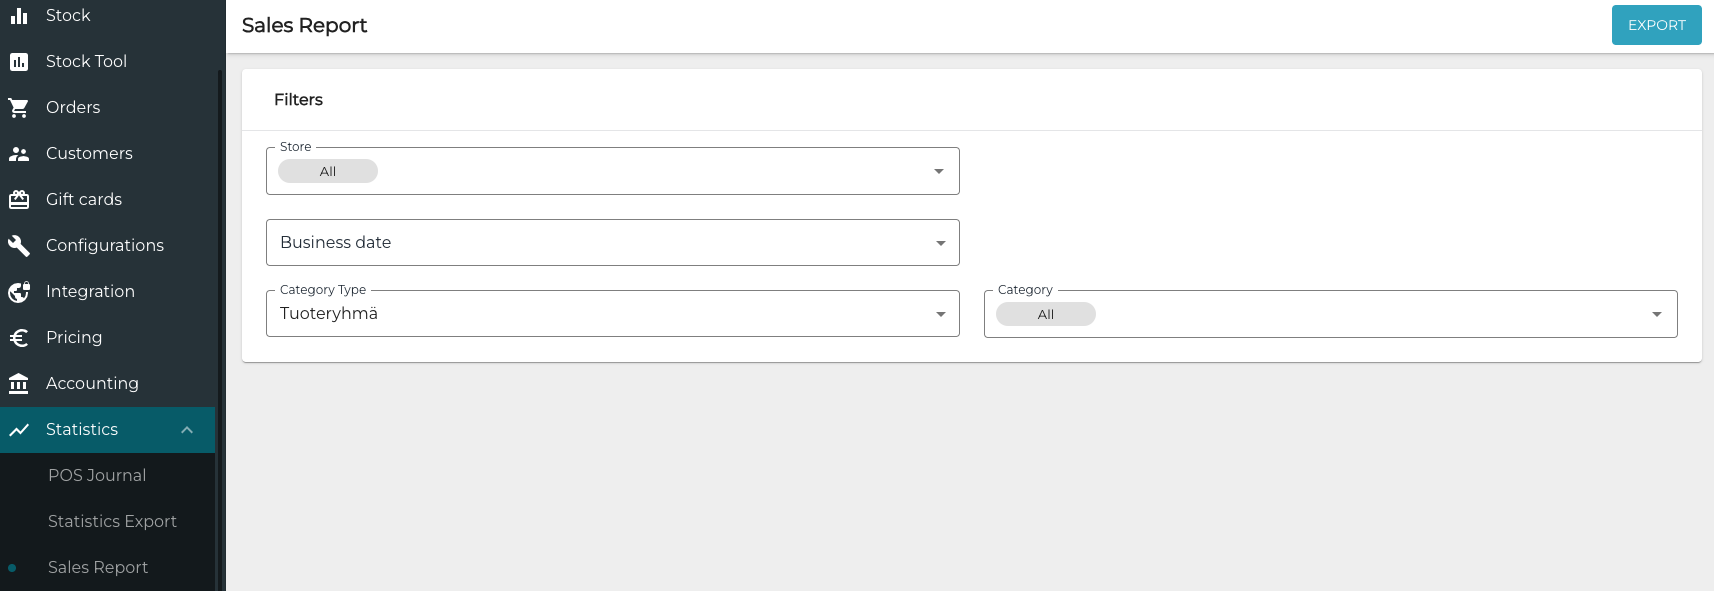
Sales Report view -
Select filters for the export.
-
Click Export.
-
Report will be generated, and you will be prompted to download the report (or the report is downloaded automatically, depending on your browser settings).
Example: Alcohol Sales Reporting for Valvira
By Finnish law Valvira requires a biannual report which contains (in addition to other data), the following data about alcohol sales:
-
Portions of alcohol (not bottles), other than beer in € (including taxes).
-
Portions of beer (not bottles) in €(including taxes).
-
Portions of alcohol (not bottles), other than beer in liters.
-
Portions of beer (not bottles) in liters.
-
Full bottles of alcohol, other than beer in € (including taxes).
-
Full bottles of beer in € (including taxes).
This is example report. The row numbers are for reference, and may differ on each generated report.
-
Rows 1-4: Filters which were used to restrict data for the report.
-
Row 5: Date, time and person name/email who generated the report.
-
Row 7: Headers.
-
Row 8: Store name.
-
Row 9: Category name. The data below belongs to this category until new category name appears.
-
Row 10: Product.
-
Rows 11-12: Ingredients which are part of this product.
-
Row 13: Category total. This is the sum of all products for given category.
-
Row 43: Store total. This is the sum of all products for given store.
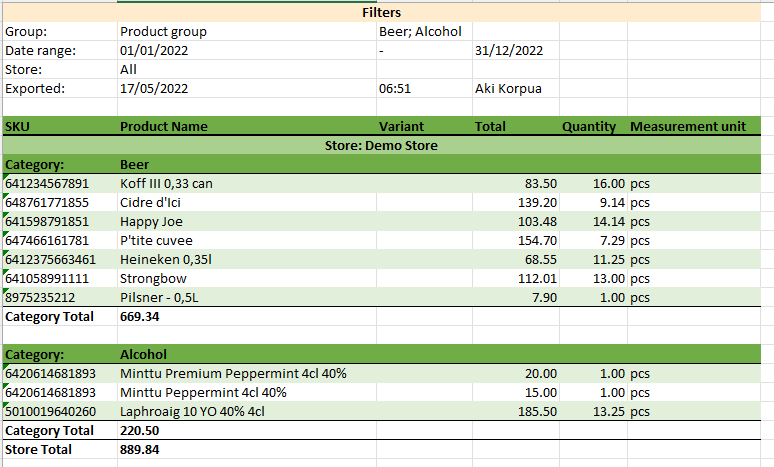
Grouped sales report example